The red-hot rental market we experienced in Central Indiana during the first half of 2020 cooled off dramatically during the 3rd quarter.
But, the term “cooled off” does need some context.
While there appeared to be plenty of potential Tenants in search of a rental home during the quarter, the apparent lack of available homes in the marketplace created some interesting numbers.
Let’s examine them a bit.
Quick Central Indiana Rental Market Overview
In total, Indianapolis saw just 530 homes lease through our MLS system. That’s a major drop from both Quarter 1 (715 homes) and Quarter 2 (701 homes).
The third quarter of 2019, which is likely a better comparison since Central Indiana is such a seasonal market, saw 626 homes lease.
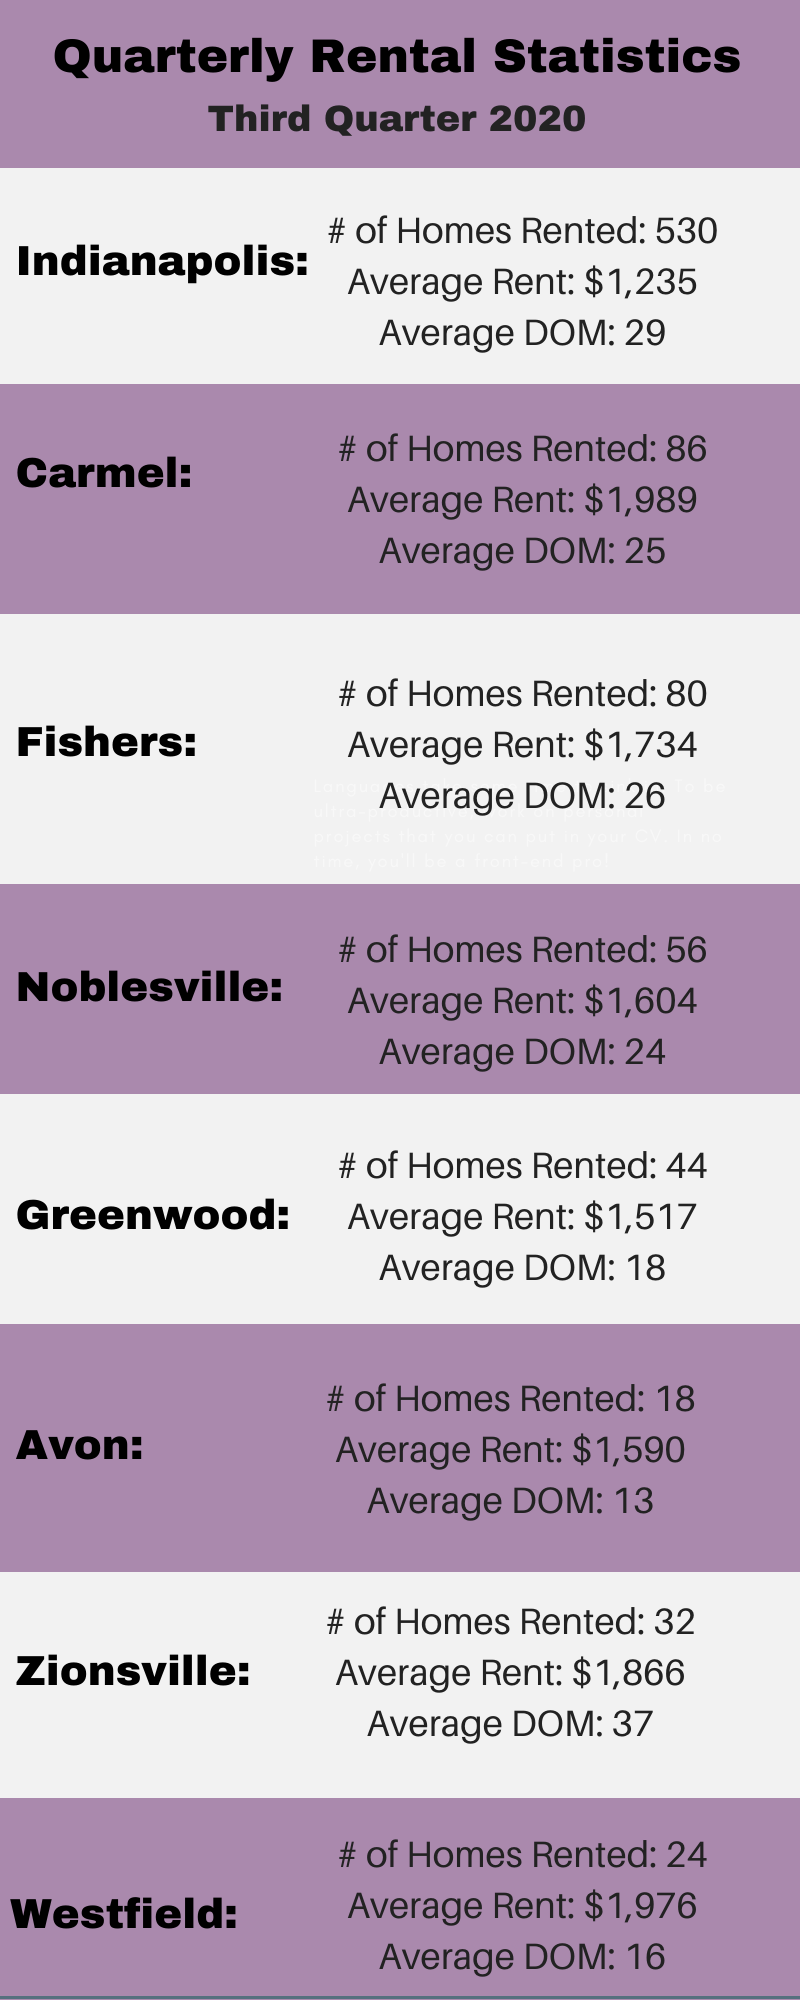
Now, let’s look at some REALLY positive numbers for Landlords:
Days on Market: Days on market – limiting them – is a huge component of being a successful Landlord.
Nothing drains cashflow like a vacancy.
Indianapolis saw an average of only 29 days on market for the quarter, which is a full, 10-day drop from Quarter 2.
We have complete rental statistics dating back to 2012 and 29 represents the lowest number we’re ever tracked.
The closest we came to this new milestone was 32 days back in Q3, 2018.
Average Rent: Average rent, also near and dear to every Landlord, remained steady at $1,235 for the quarter, down only fractionally from $1,240 the previous quarter.
The Housing Market is en Feugo
So, what do all these numbers mean?
Well, if you’re in tune with the real estate sales market in Indianapolis, you know that it’s simply on fire.
MIBOR released information recently that Indianapolis has seen year-over-year appreciation of 11.2% and that pending sales are at their highest levels in 10 years.
Our Clients, and other investors, are aware of this.
As Tenants vacate homes, many investors are now opting to sell instead of re-rent. This has put a lot of pressure on rental inventory, which is likely the main cause for the drop in overall homes rented.
T&H Realty Services’ Perspective
Like the overall market, we had some record-setting days on market as well for the quarter.
In fact, our average days on market for both August and September were just 9.
Our total leasing numbers, due to continued growth and, therefore, available inventory, were also strong.
As we have noted multiple times, COVID-19 has had little to no impact on Central Indiana rental market.
Prepare for the 4th quarter accordingly
Some preliminary data to begin the 4th quarter isn’t overly optimistic.
While it’s still very early, our showing levels have dropped – dramatically – during the first two weeks of October.
As you should know, the fourth quarter is generally fairly slow to begin with, so it’s important to ensure you are priced right and your condition is strong. Both of these factors will help reduce your vacancy period.
If you are a Client of ours who has a property on the market now – or a property that will hit the market soon – Claire Holdsworth, our Rental Marketing Manager, will be in touch with you soon to discuss some seasonal strategies we have in place.